Rebuilt from the ground up, Google Analytics 4 is the new avatar of the data-collecting platform you’ve grown accustomed to over the years. It intends to transform how data is collected by delivering its users holistic data measurement capabilities across both websites and apps.
However, as GA4 has been rebuilt for the new era of data analytics, using it comes with a fresh learning curve if you wish to navigate your way properly through the site. Let us then cover everything essential about the GA4 right from its differences to UA, how to get started, and the new changes that will help you understand the user behavior better.
Google Analytics 4: What’s Changed
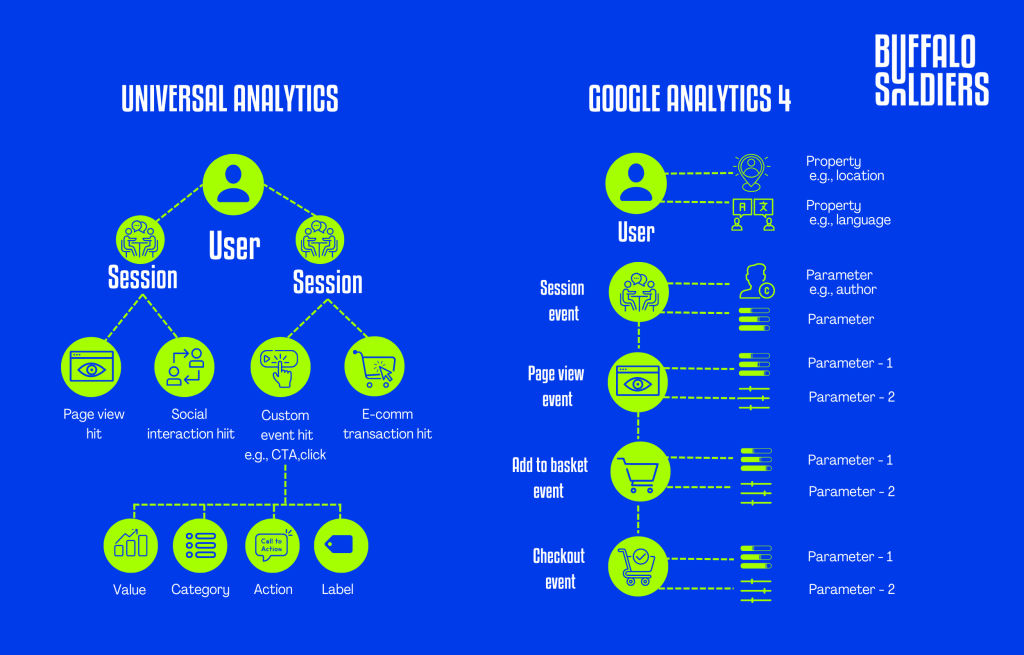
Quite a lot. Unlike the older GA we’ve been used to, GA4 is built around users and events instead of sessions. This different data collection structure and logic allows GA4 to process each user interaction as a standalone event.
Earlier, user interactions were grouped within a given time frame. However, with GA4’s event-based model, marketers can better perform cross-platform analysis and have an enhanced capacity for pathing analysis. This change significantly helps in predicting user behavior in a flexible and timely manner. It’s a known fact that the better your data collection strategies are, the more informed your marketing strategies will be.
How To Configure GA4
Setting up GA4 is as easy as it gets. Here’s a step-by-step guide for you to follow along:
- Login to your Google Analytics Account.
- Click on Admin, the Gear icon that’s on the bottom left of the navigation bar.
- Ensure that the correct account is selected.
- Confirm that the desired property is selected.
- Click GA4 Setup Assistant – it will be the first option in the Property column.
- Once inside the Setup Wizard, click the large blue button, Get Started.
- Click on the blue Create Property button and get started
If you use WordPress or other similar website builders, you will have to add the Analytics tag by yourself. GA4’s setup assistant automatically works with gtag,js.
Event Tracking
![]()
Once you’re done creating your property, the setup assistant will automatically activate enhanced measurement in your GA4 property, and the most basic forms of event tracking will be ready to go. In case you need to track third-party elements and form submissions, you’ll need custom code to get around that.
How Does GA4 Help With Reporting?
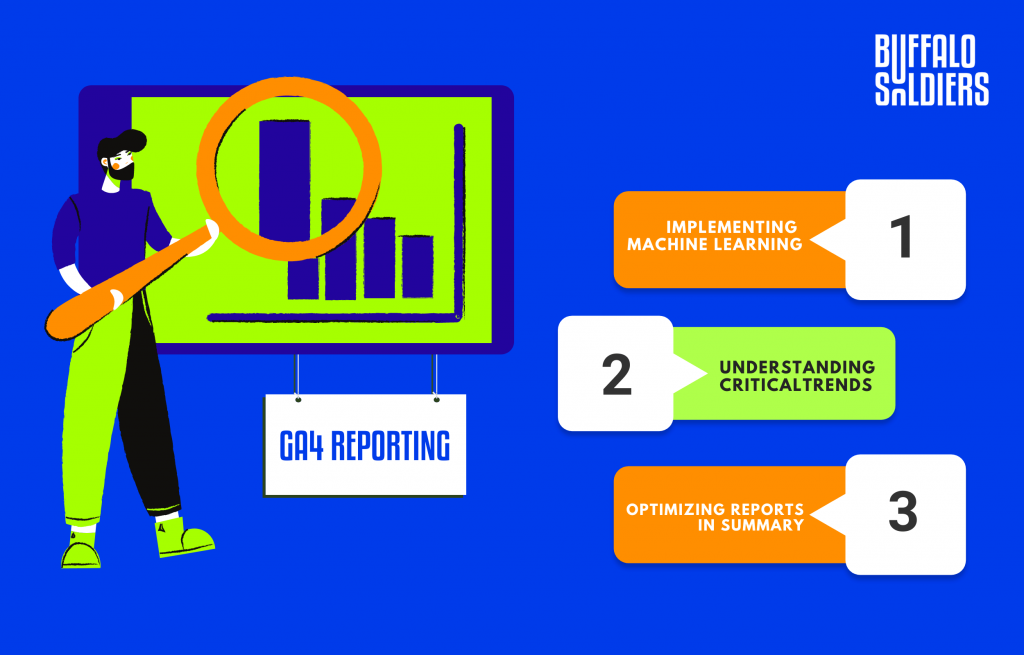
With the prevalence of user privacy, tracking users across multiple platforms on multiple devices gets very tricky very quickly. GA4’s solution? Use sophisticated machine learning techniques to fill in the gaps of the missing data. It will create a single user journey linked to the same identity for all your data.
With its simplified reporting interface, GA4 helps marketers spot and understand critical trends and remove any irregularities in data. Gone are the days of long lists of predefined reports that cover every use case. GA4 instead uses overview reports in summary cars to create a data collection strategy that’s worth every penny. And if you want to tinker any further, just click on the scorecard.
Best Ways To Use Google Analytics 4 Reports
After you log in, you’ll find that the homepage summarises overall traffic, conversions, and revenue for the property you entered. You can use this to ensure that everything works as expected. Your homepage report will include answers like
- What are your top-performing campaigns?
- Which pages and screens get the most views?
- Where do new users come from?
Also Read:
Realtime Report
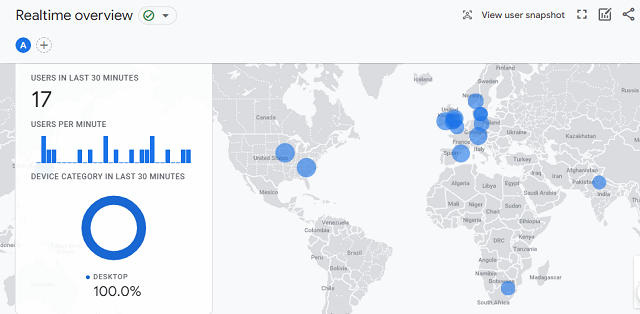
The Realtime report is the next default report found in the left navigation bar. It shows all events that happened within the past 30 minutes, thus the name. Use the Realtime Report quickly to :
- Confirm tracking code is working.
- View New Product Drop as it happens in real-time.
- View Effects from a YouTube Video.
Bonus Feature: “View User Snapshot”
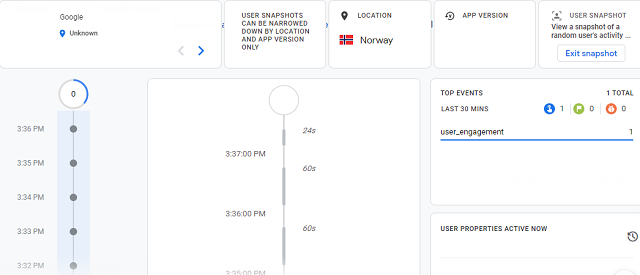
Clicking on View user snapshot on the top right corner of the real-time report will show you a literal snapshot for a single user. This can include information like the user’s mobile device, their location, and real-time engagement on your site/app.
Life Cycle Reporting
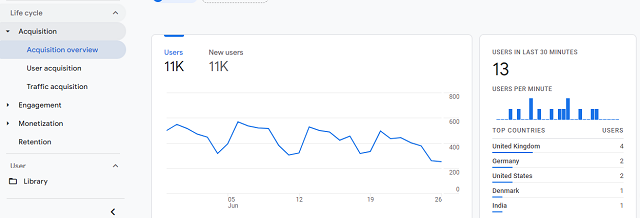
Life Cycle reporting acts similar to the funnel of acquiring, engaging, monetizing, and retaining users. It’s perfect to analyze how users enter the conversion funnel and how they behave once they’re a part of it. It also includes user reports based on tech and demographics. The Life Cycle reporting page will quickly answer questions like:
- How do users enter the conversion funnel?
- How do users behave once they’re in the funnel?
Explorer Reports: Analysis
When we talk about the most important changes in Google Analytics 4, this is what most people think will be to benefit marketers. This fresh Analysis Hub will default reports to help you keep a record of the most key business metrics. It will give you access to a template gallery that isn’t found anywhere else and several sophisticated techniques to manage data.
Creating A New Analysis
- Login to your Google Analytics Account.
- Click on Analysis.
- Click on Graph, the magnifying glass icon on the bottom left navigation bar under Explore.
- Select one of the several techniques you want to use to analyze your data.
How To Read Analysis Hub Reports
- Go back to the Analysis Hub.
- Variables Column: This is where you will select the data you want to use in your analysis. You can select the date range, segments, dimensions, and metrics.
- Tab Settings Column: This is where you can specify the analysis technique, add dimensions and metrics, as well as apply segments.
- Segments: Segments are simply different groups of users. Comparing how different groups of users behave can be done by dragging and dropping them into your report. Click on the plus icon to add your segment if you don’t see the segment you want.
- Dimensions: Dimensions are the things you wish to analyze, such as event count, active users, transactions, etc. Drag and drop dimension rows and columns in the Tab Settings area.
- Metrics: Metrics will provide you with the numbers in your analysis. You can add metrics to the Values area in Tab Settings.
- Visualization: This will help you decide how the report will look. You can choose from a table, pie chart, line graph, and more.
- Values: You can display the metrics by dragging them into the report as columns, where cell types can be displayed as a bar chart, plain text, or a simple heat map.
- Tabs: Tabs are used to display your visualizations. An analysis can contain up to 10 tabs. To add a new tab, click the plus icon.
- Display: Right-click a data point in the visualization to interact with it.
Types Of Analysis
Exploration
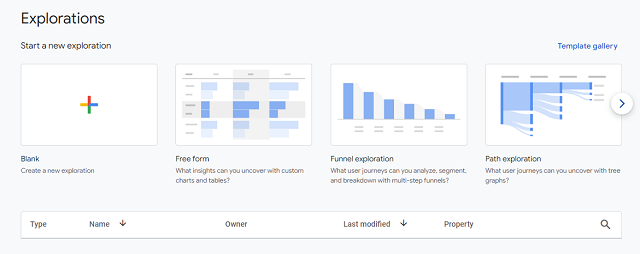
In comparison with Universal Analytics, GA4 Exploration offers more control over the data visualization. Exploration provides many configuration options to help you discover new insights and display your data in a way that makes sense to you, your team, and your clients.
One of the most beloved features in exploration is anomaly detection because it flags any data points inconsistent with the expected outcome.
Funnel Analysis
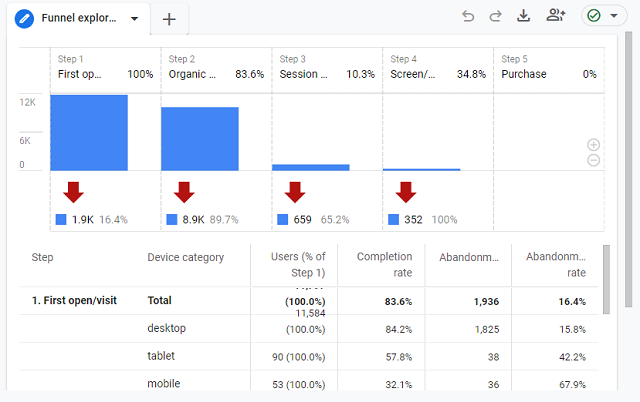
Wish to know how website visitors become one-time shoppers and how those one-time shoppers can be converted into repeat consumers? That’s where the Funnel analysis report of GA4 comes in. Use this to visualize all the steps that shoppers take to complete an event and understand the conversion journey by analyzing their behavior at each step.
Path Analysis
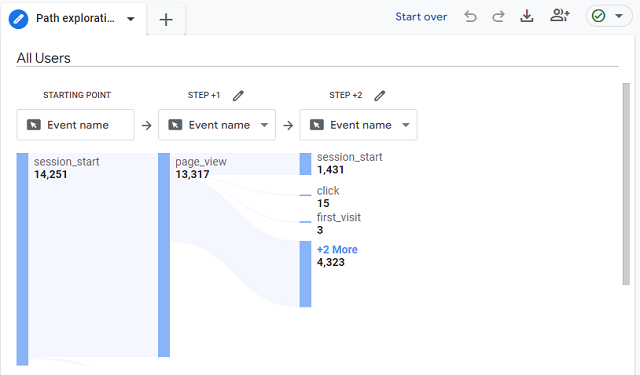
Fans of the behavior flow reports in UA will love the analysis hub pathing reports found in GA4. Path Analysis will visualize the event stream(the series of events users triggered along their path) in something called the ‘tree graph’. This new technique will aid marketers in uncovering looping behavior and help them understand where users are stuck on their websites.
Segment Overlap
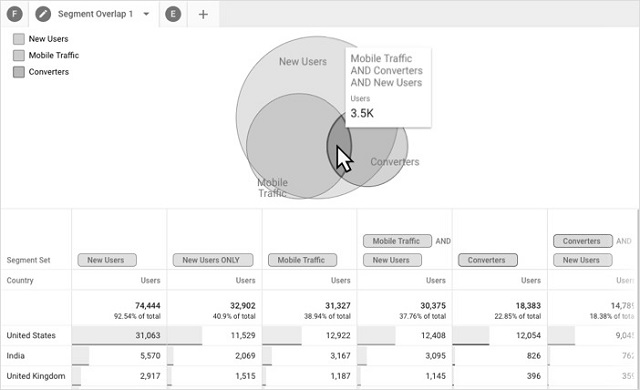
Segments are found in both UA and GA4 properties. In GA4, however, segments are used as user events or sessions where marketers can create segments containing multiple conditions and arrange them in a ‘condition group’.
To better understand this, imagine that a segment is a specific group of your site users. A segment can be users from a particular city who visited a specific page, or it can be users who took a distinct action like purchasing from a specific product category.
Cohort Analysis
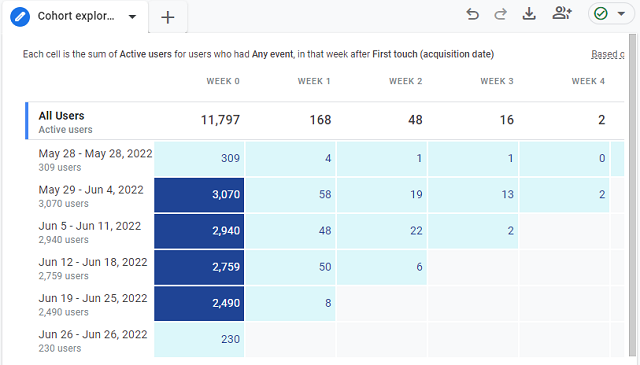
The term cohort refers to a group of users who share a characteristic, such as the same acquisition date, event, or conversion. Using a cohort report, you can determine the conversion rate for an individual marketing tactic.
User Lifetime
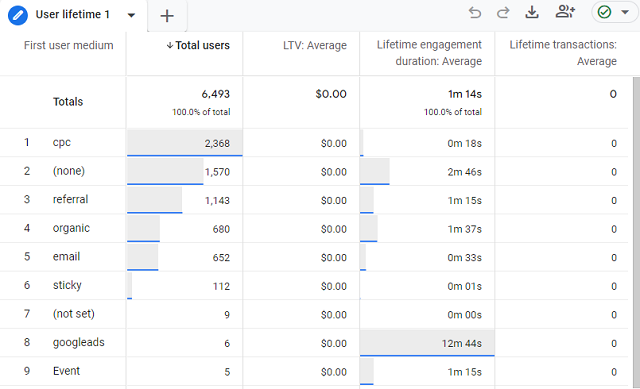
The user lifetime report is remarkably effective because it allows search marketers to generate reports that clearly show the source driving the most revenue over the lifetime of users and not just the top source for a particular month.
Thanks to Google Analytics predictions models, the GA4 identifies marketing campaigns that convert the most valuable users with the lowest churn rate and the highest purchase probability.
And Therefore…
One of the most powerful marketing tools you can have is an analytics tool. It allows the development of a deeper understanding of website traffic and how visitors behave once on the site. More insight into analytics leads to better marketing decisions.
Predicting user behavior on your site or app shouldn’t come at the cost of user privacy -this is where Google Analytics 4 shines. GA4 was a much-needed upgrade for marketers who wished to look at their data more flexibly and deeply. After getting past the learning curve, you will love the new features and the granular approach to understanding user behavior through GA4’s tools.
Buffalo Soldiers is one of the best SEO companies in India and we provide digital marketing services. Are you looking to transcend the competitive landscape and make a formidable impact? Contact us, we might know a thing or two.